
Outputs
General Info
Forecasts for two historical years were selected for the purposes of demonstrating the approach under particularly high (2020) or low (2009) activity years ("Backtest") and for the current year 2023 ("Forecast"). For this example we assume there is a binary payout in the case of a Cat1+ event.Overview
This section displays a summary of the outputs from the decision framework based on the values entered in the Inputs section, as well as results of how the cover would have performed for backtest years. The market-implied rate expressed the market premium as a frequency rate, and the actual event rate shows what actually happened in the relevant year. More detailed explanations of the column headers can be found in the Info section.The aim of the confidence approach is to determine the rate which the user can (with the required confidence) expect not to be exceeded. This should not be seen as a method that minimises the absolute forecast error. There is inevitably a tradeoff which comes into play when allowing for individual risk preferences in determining this rate.
View from IBTrACs climatology
This view uses the rates derived from the historical data (climatology). The historical data is segmented based on different scientific narratives (e.g., ENSO phase), giving a number of different views. More detail on the different views used for this analysis can be found in the Info tabView from seasonal forecasts from Seasonal Hurricane Predictions
This view uses the rates derived from a number of credible seasonal forecasts released by various private companies and academic instituions in advance of the US hurricane season. See the Info tab for more detail on which forecasts are incorporated in the tool. For the seasonal prediction initiative we applied a 20% factor to North Atlantic hurricane rates to get to US rates, based on the US landfall/North Atlantic Basin-wide ratio estimated from 1980-2020 IBTrACS data.View from seasonal forecasts from Reask
This view uses the rates derived from Reask's seasonal forecast and climatology. Reask's machine-learning TC model long-term view is driven by the climate stated from 1980 to 2020; it is not taking into account current climate conditions. The latest available climate conditions at the time of forecast are fed into the machine learning algorithm to generate an adjusted trackset (with over 50k stochastic seasons).Overview
This section displays plots illustrating the spread of different Cat 1+ Hurricane landfall rates for each model. The light green dot represents the median of all model runs. The bars show the spread of outcomes taken for each level of confidence required, the top-end of the bar is selected as the "confidence-loaded" figure used to represent an appropriate technical rate.View from IBTrACs climatology
The plot in this section shows the rates derived from the historical data (climatology). Each of the dots on this plot represents a specific segmentation of the historical data based on a given scientific narrative (e.g., ENSO phase), giving eight views in total. More detail on the different views used for this analysis can be found in the Info tabView from seasonal forecasts from Seasonal Hurricane Predictions
The plot in this section shows the rates derived from a range of seasonal forecasts from various private companies and acamdeic institutions. Each of the dots on this plot represents a separate entity's forecast. For the seasonal prediction initiative we applied a 20% factor to North Atlantic hurricane rates to get to US rates, based on the US landfall/North Atlantic Basin-wide ratio estimated from 1980-2020 IBTrACS data.View from seasonal forecasts from Reask
The plot in this section shows the rates derived from Reask's seasonal forecast. Each of the dots on this plot represents a separate set of stochastic track runs.General Info
Where does the framework come from?The framework stems from foundational catastrophe risk challenges presented to Profs. Roman Frigg and Richard Bradley by Tom Philp starting in 2016. From there, a theoretical hurricane problem was constructed, and a peer-reviewed paper was consequently published by Joe Roussos, Roman Frigg and Richard Bradley "Making Confident Decisions with Model Ensembles". The practical framework presented on this page is the first attempt to make practicable the theoretical framework from that foundational paper.
Where does the data come from?
The only external data that the tool ingests is Tropical Cyclone information.
The raw observational climatologies (historical data) are avaialble from the International Best Track Archive for Climate Stewardship (IBTrACS). The seasonal predictions for 2023 are available from their website Finally, Reask provide ECWMF-climate model/reanalysis connected stochastic Tropical Cyclone tracksets. More information available from Reask's website.
Is this a hazard or loss focused tool?
While the output is shown as losses, it is stressed (as described above) that the tool makes a simple (i.e. binary parametric payout) leap from a cat 1+ landfall to total loss. Thus, at present this is a hazard focused tool, with loss figures provided primarily to allow a user to philosophically connect with how this can theoretically be used in cat risk management.
What is coarse-graining?
Coarse-graining is the process of dividing model predictions (in this case annual TC landfall rates) into different ranges for the desired level of confidence required in the decision (named low, medium and high in our framework). This is done by ranking the model predictions based on their distance from the median estimate. The closest third of model estimates to the median represents the low confidence range, the closest two thirds of models to the median the medium confidence range, with the high confidence containing all the rates. As stated in the Inputs section, the "confidence adjusted" view in our Results section takes the upper bound of each range to calculate the technical premium.
By coarse-graining the cautiousness levels (as in Roussos et al 2021) and overlaying with the stakes information, we attain the upper bound of the solution space most appropriate for the risk, and thus an eventual recommendation for the price of the risk (leaving aside acquisition expenses, operating expenses and capital loading considerations).
Reask's Approach
The Reask UTC modelling approach generates stochastic Tropical Cyclone (TC) event sets directly from climate model output. This approach is flexible enough to both allow for climate model conditioned views of TC in the present and the ingestion of future-focused climate model data.In this iteration of the Reask UTC, seasonal forecasts are taken from the ECMWF SEAS5 forecasting system, which produces a 51-member initial condition ensemble climate forecast for the six months ahead.
This forecast is updated monthly by ECMWF. Reask generates 1000 stochastic TC track years per ensemble member, creating over 50k years of stochastic TC activity – specifically focused on the season ahead – each month as the ECMWF forecast updates. The skill of the seasonal Reask TC sets, as quantified through backtesting against historical climatology for the period 1993-2021, is shown in the table below.
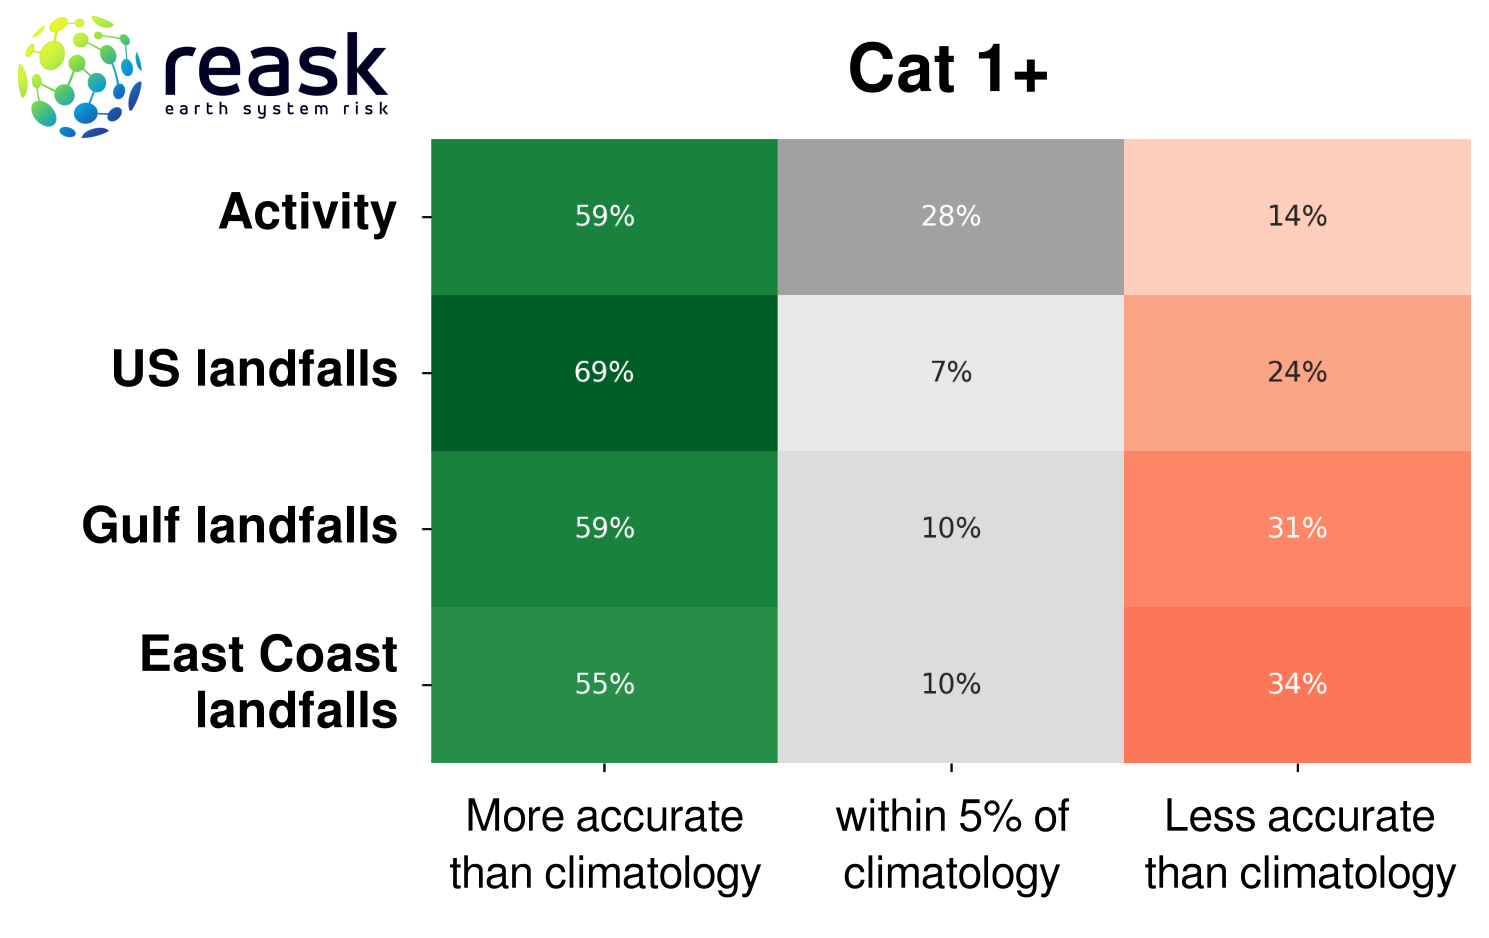
- if forecast deviation to the long-term rate is in the same direction as the outcome => green,
- if the forecast is +/-5% the LT rate => grey,
- anything else => red
Results Tab Glossary
Event Rate: The average annual frequency or rate for the given approach across all relevant models.Adjustment vs LTR: The extra margin over the event rate required to write the risk, expressed as a percentage of the IBTrACS LTR event rate.
Forecast Error: The difference between the projected event rate and the actual event rate that transpired during the year in question. A positive sign indicates an overestimate and a negative sign an underestimate.
Technical Premium: The suggested premium charged for the cover based on the selected approach. This can be given as Event Rate x Max Payout. Where we are using the confidence-loaded approach, this additional confidence load must be taken into account. E.g., if the mean rate is 0.2, the payout from an event is $1m and the confidence load is 10%, the capital provider would need to be paid at least 0.2 x ( 1 + 10%) x $1m = $220k to write the risk. We ignore cost of capital/expenses here so this is not factored into the calculation.
Underwriting Decision: The decision taken by the capital provider as to whether to use their capital to write the cover in question. There are only two outcomes here, "Write" or "Don't write". It is assumed the capital provider writes the risk if they receive at least the Technical Premium calculated under the approach, and otherwise do not write it.
Return: The return the capital provider would receive after receiving the market premium and paying any losses. If losses occur during the year and they have chosen to write the risk, then these are deducted from the premium to give the overall return. If they do not write the risk then the return is simply zero.
Market Premium: The actual premium determined by the broker/client. This is selected by the user and can be adjusted using the slider to give a rough idea of how this might vary with the market cycle. The default and middle of the slider is set to the Long Term Rate (LTR) average rate from the IBTrACs (historical) data multiplied by the Max Payout with a 20% margin. This is an arbitrary selection and is not meant to be reflective of actual market conditions.
Market Implied Rate: The landfall rate implied by the market premium. Corresponds to Market Premium / Max Payout.
Actual Rate: The actual landfall or event rate during the season. So in this case the actual rate represents how many Cat1+ hurricanes made landfall at the relevant gate during the season in question.